Packery Channel Hydrodynamic Model (PCH-Model)
Summary
The Packery Channel Hydrodynamic Model (PCH-Model) was developed by the Conrad Blucher Institute for Surveying and Science to support a broader understanding of processes that impact shoaling and scour in Packery Channel and as a problem-solving tool for inlet management. Applications of the model include:
-
- Forecasting
- Impact of storms on flow velocity
- Long-term changes in flow patterns/trends
- Impact of changes to the channel system on flow velocity and duration of peak and minimum flow necessary to reduce shoaling (including new channels that are connected to Packery Channel such as at PR22)
- Future Application: Long-term changes in flow patterns/trends
- Future Application: Assessment of structural design alternatives to increase success of
- post-storm restoration design
- Hindcasting
- Implications of storm forcing on channel shoaling/scour dredge planning
- Implications of storm forcing on scour related to specific structural failure and damage assessment and design
- Forecasting
Original Video
Original Video Reduced Speed
Model Development
The development the PCH-Model was funded internally by CBI to assist in gaining a broader understanding of hydrodynamic forces acting at Packery Channel in an effort to provide additional tools for supporting resource management. The principal investigator for this project is Dr. Philippe Tissot who supervised Mr. Larry Dell and Andrew Miller (TAMUCC students) in collaboration with Deidre D. Williams developed and refined the model to address questions related to past storm events and future proposed channel changes. This calibrated Delft 3D model was initiated to compare performance with a prior 2D model built by Sergey Reid with CMS-Flow (Reid et al., 2014). The PCH-model is in part a precursor to a full Corpus Christi Bay model or to other high-resolution inlet models. The effort was fostered through interaction with CBI staff that were directly involved in the Packery Channel Monitoring Program (PCMP) in order to increase the potential for application to problem solving related to management of the channel system.
The first application of the PCH-Model was as student project to investigate changes in current velocity in Packery Channel system if a new channel connection between the Upper Laguna Madre to the Gulf of Mexico via Packery Channel was constructed. The channel location and pathway were conceptual and did not represent the actual proposed footprint of the proposed Hwy 22 project. During this process, the model was run for actual present footprint of Packery Channel system and was validated applying current velocity measurements that are measured in Packery Channel and the Gulf Intracoastal Waterway (http://lighthouse.tamucc.edu/qc/138 and http://lighthouse.tamucc.edu/qc/150). The measurement of current velocity is critical to model development and assessment of validity.
Monitoring Stations Fundamental to Model Development and Application
Data required for application to modelling efforts has been sponsored by the USACE and City of Corpus Christi. Presently there is no sponsor for the monitoring stations. Without current velocity data it is not possible to validate model results. Presently the maintenance and online data access for monitoring stations are not funded. Funding for the maintenance of the current monitoring stations has been included in a proposal for City review. Without accurate data to validate the model, the success of future applications of the model when need arises will be limited or non-existent. Once monitoring stations are dismantled additional cost would be needed to redeploy the stations; easily doubling the cost of annual maintenance in order to re-establish the stations.
PCH-Model Application to Hurricane Harvey
The PCH-Model was developed as a problem-solving tool. The force of flow through Packery Channel during Hurricane Harvey resulted in substantial damage to inlet structures and City infrastructure. To better understand the focus of damage along the south revetment and between the Packery boat ramp parking and HWY 361, a Hurricane Harvey hindcast model run was initiated. The hindcast model differs from a forecasting model because the data applied to drive the model was measured during the event of interest. Development of the hydrodynamic assessment during Harvey included gathering and applying the bathymetric data prior to Harvey, as well as water velocity, wind, and water level data. The model was validated by assessing predicted changes in water level and current velocity as compared to changes measured in Packery Channel.
The model accurately represented the conditions occurring during the storm including the breach of Hwy 361 and re-entry of flow into Packery Channel between the boat ramp parking lot and the east easement along Hwy 361. The breach occurred as water within and that entering Corpus Christi Bay and the Upper Laguna Madre as the storm approached reversed as the storm moved inland. Flow of water toward the Gulf of Mexico was reinforced by strong winds directed out of a westerly direction as the storm moved onshore and westward.
The breach over the HWY 361 provided for two pathways of flow to merge in the Deposition Basin. Combined flow resulted in peak velocities from the basin to the channel mouth during Hurricane Harvey. The merging flow resulted in peaks flow velocities and turbulent flow directed toward and along the southern revetment in the Inner Entrance Channel. Flow was identified as turbulent in comparison with the pattern of typical ebb flow that preceded Hurricane Harvey as shown in Figure 1a and 1b. Figure 2 and 3 show examples of turbulent flow developing as HWY 361 was breached. Ebb flow was sustained continuously for approximately 30 hours with peak ebb flow velocity of 1.5 m/s sustained between the Deposition Basin and into the Gulf of Mexico for approximately 7 continuous hours. Figure 4 shows the breach of HWY 361 and peak ebb flow velocities extending without interruption from the Deposition Basin to and including the Gulf of Mexico. Pulses of peak ebb flow of near 1.5 m/s continued for an additional 10 hours in both the Deposition Basin and Entrance Channel as shown in Figure 5.
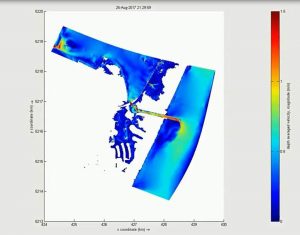
Figure 1. Comparison of typical ebb flow before Hurricane Harvey(A) and turbulent ebb flow during Hurricane Harvey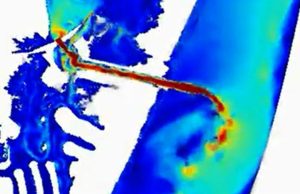
Figure 2. Turbulent flow initiates in the Deposition Basin prior to the beach of HWY 361.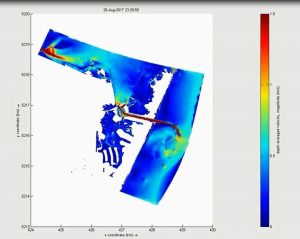
Figure 3. Turbulent flow initiates in the Deposition Basin as water begins to breach HWY 361 during Hurricane Harvey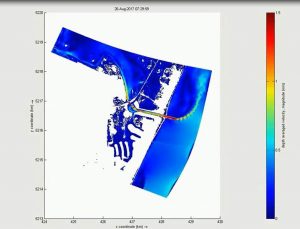
Figure 4. Peak flow velocity of 1.5 m/s was observed in Packery Channel from Hwy 361 to and into the Gulf of Mexico as the breach of HWY 361 occurred during Hurricane Harvey (Aug 25 2018 23:29). Peak velocity was maintained for 7 continuous hours.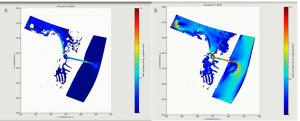
Figure 5. Pulses of peak (1.5 m/s) velocity continued in the Deposition Basin and Entrance Channel for an additional 10 hoursReferences:
Dell, L., Tissot, P., Williams, D., Koskowich, B. and Durham, N. (2017) “ Hydrodynamic Modeling of Engineered Inlet and Canal Extension” Oral Presentation at the 2017 American Meteorological Society Meeting, Seattle, WA
https://ams.confex.com/ams/97Annual/webprogram/Paper302979.html.Reid, S. K., Tissot, P. E., & Williams, D. D. (2014). Methodology for applying GIS to evaluate hydrodynamic model performance in predicting coastal inundation. Journal of Coastal Research, 30(5), 1055-1065.